
Every mobile app owner wonders if their product is successful. What metrics should be measured to assess the popularity of the app, user engagement, and financial success? Competent analytics provides valuable information for future decision-making. Let's work through this complicated issue together and understand which metrics need to be tracked and why.
All metrics can be divided into several categories:
1) Source of app installation
Helps you assess how well marketing is working in your project to attract customers.
2) User retention and engagement metrics
Shows how many users are using your app, how often and for how long.
3) Session characteristics
Helps you evaluate the duration of time a user stays in the app.
4) Financial metrics
Track the progress of how successful your app is financially.
Source of app installs
Start with the basics - track where your users are coming from. It will be very helpful to record how many users come from each source each month, especially in the first year after release.
Installs
The number of installations of your app. Is the easiest metric to measure the popularity of your product.
Uninstalls
The lower the number of users who uninstall your app, the larger your audience is.
Why users uninstalls apps:
- They don't like the app - it doesn't meet their needs, is too complicated, has too many ads, etc.
- The app is no longer needed, for example, if the product was downloaded for one-time use. This issue depends on the business area and the purpose of the app.
- There are different technical reasons, for example, the user runs out of memory on the phone.
- There are bugs - technical problems when starting or working with the app.
- The signup process is needlessly long or difficult.
Session duration and frequency
A session is the time interval between the user's first action after starting the app and the user's last action before closing it. You can track:
Average session length
Average session length = Total time using the app / Total number of app sessions
Average daily sessions per user per day
Average daily sessions per user = Number of daily sessions / Number of daily active users
Session interval
Retention Rate
Customer retention rate is a key metric for apps that allows you to save your budget on new user acquisition and grow through repeat purchases. It's simple: the customer is happy, loyal, and doesn't need to be introduced to the brand from scratch.How do you calculate the retention rate? Determine the period you want to track the figures for: a day, month, year, etc. In analytics, a month is the most common period that is usually enough to run a campaign or test a hypothesis.
RR = ((Number of clients in the end of the period - Number of clients who came for the whole period) / Number of clients at the beginning of the period) * 100%
What percentage of RR is considered to be successful? There are many opinions about it, of course, the industry is important. But the higher this figure, the better.
How do you increase RR?
If your retention rate is low, something is wrong. Maybe the product registration form is too complicated, or you can't convey the benefits of your product. The reason could be anything, there are some proven ways to increase RR:
- Develop communication
Bring value to the customer - through content, instructions, presentations. This way, you can increase brand expertise in the customers' eyes and help them solve their problems.
- Collect feedback and work with it
Customers like to be heard and listened to.
- Take care of convenience
Analyze the UX design. Maybe the problem is the complexity of the app?
- Run promotions and special offers for loyal customers
Churn Rate
The opposite of the Retention Rate is the Customer Churn Rate is the Customer Churn Rate which is the number of users who unsubscribed. You can calculate the index by knowing the total number of users and the number of those who left over a period of time. It is important to choose the right period of time that should depend a lot on the frequency of purchases. For example, if you have an annual subscription, it does not make sense to count the churn for months because a repeat purchase will not be made until a year later.
Churn Rate = (Lost customers/Total customers)*100%
If you see a high churn rate, it's worth analyzing the reasons why. As in the case of RR, there are no normative values. It all depends on the field of activity and the specifics of the business. The lower the bounce rate is, the better.
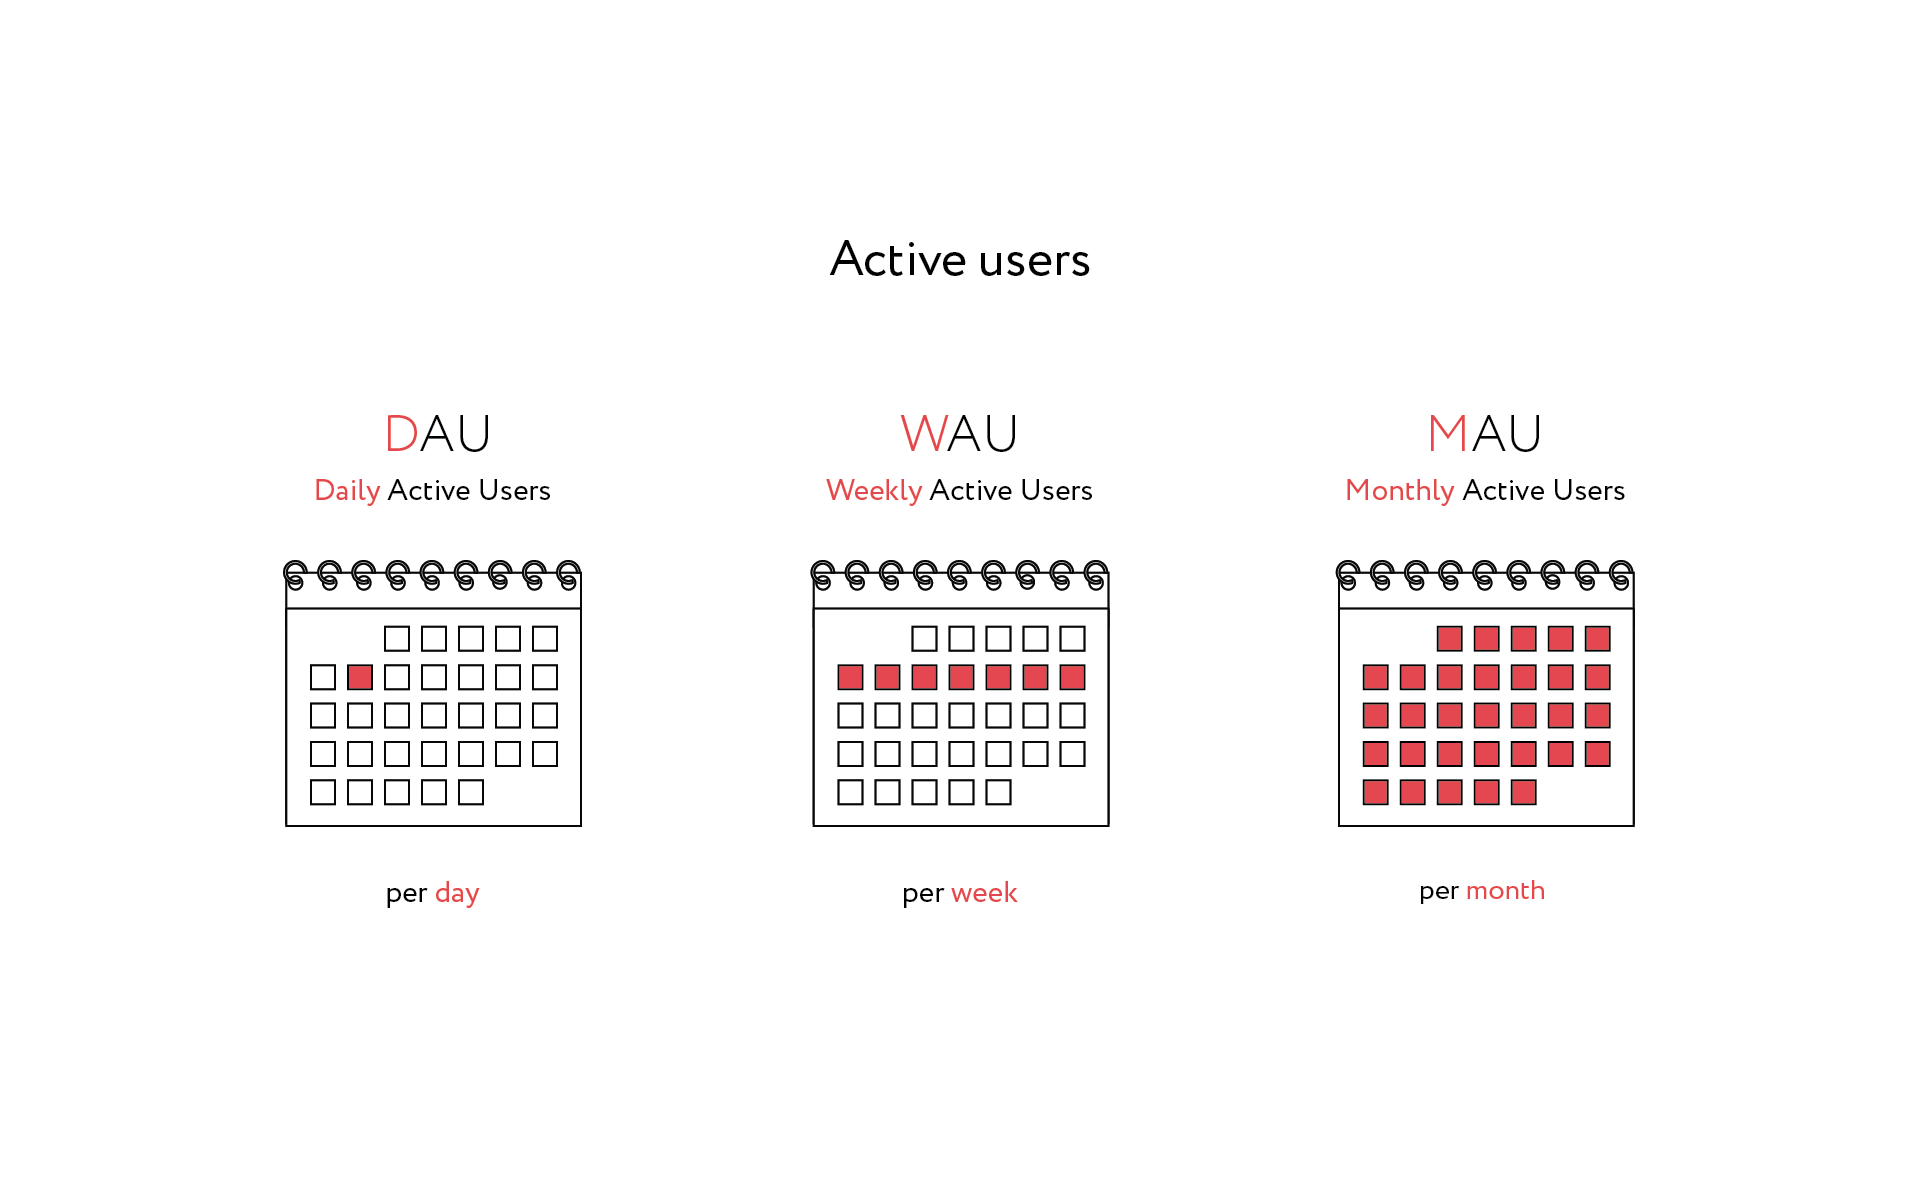
Daily Active Users (DAU) Number of users daily.
Weekly Active Users (WAU) Weekly Active Users.
Monthly Active Users (MAU) The number of users who have used the app at least once in the past 30 days.
Cost per acquisition (CPA)
This metric will help you evaluate the effectiveness of your advertising campaigns. CPA=Costs / Number of users purchased
Customer Acquisition Cost (CAC)
Customer Acquisition Cost is calculated by the formula:
CAC = the amount of advertising budget spent on attracting new customers / number of customers attracted.
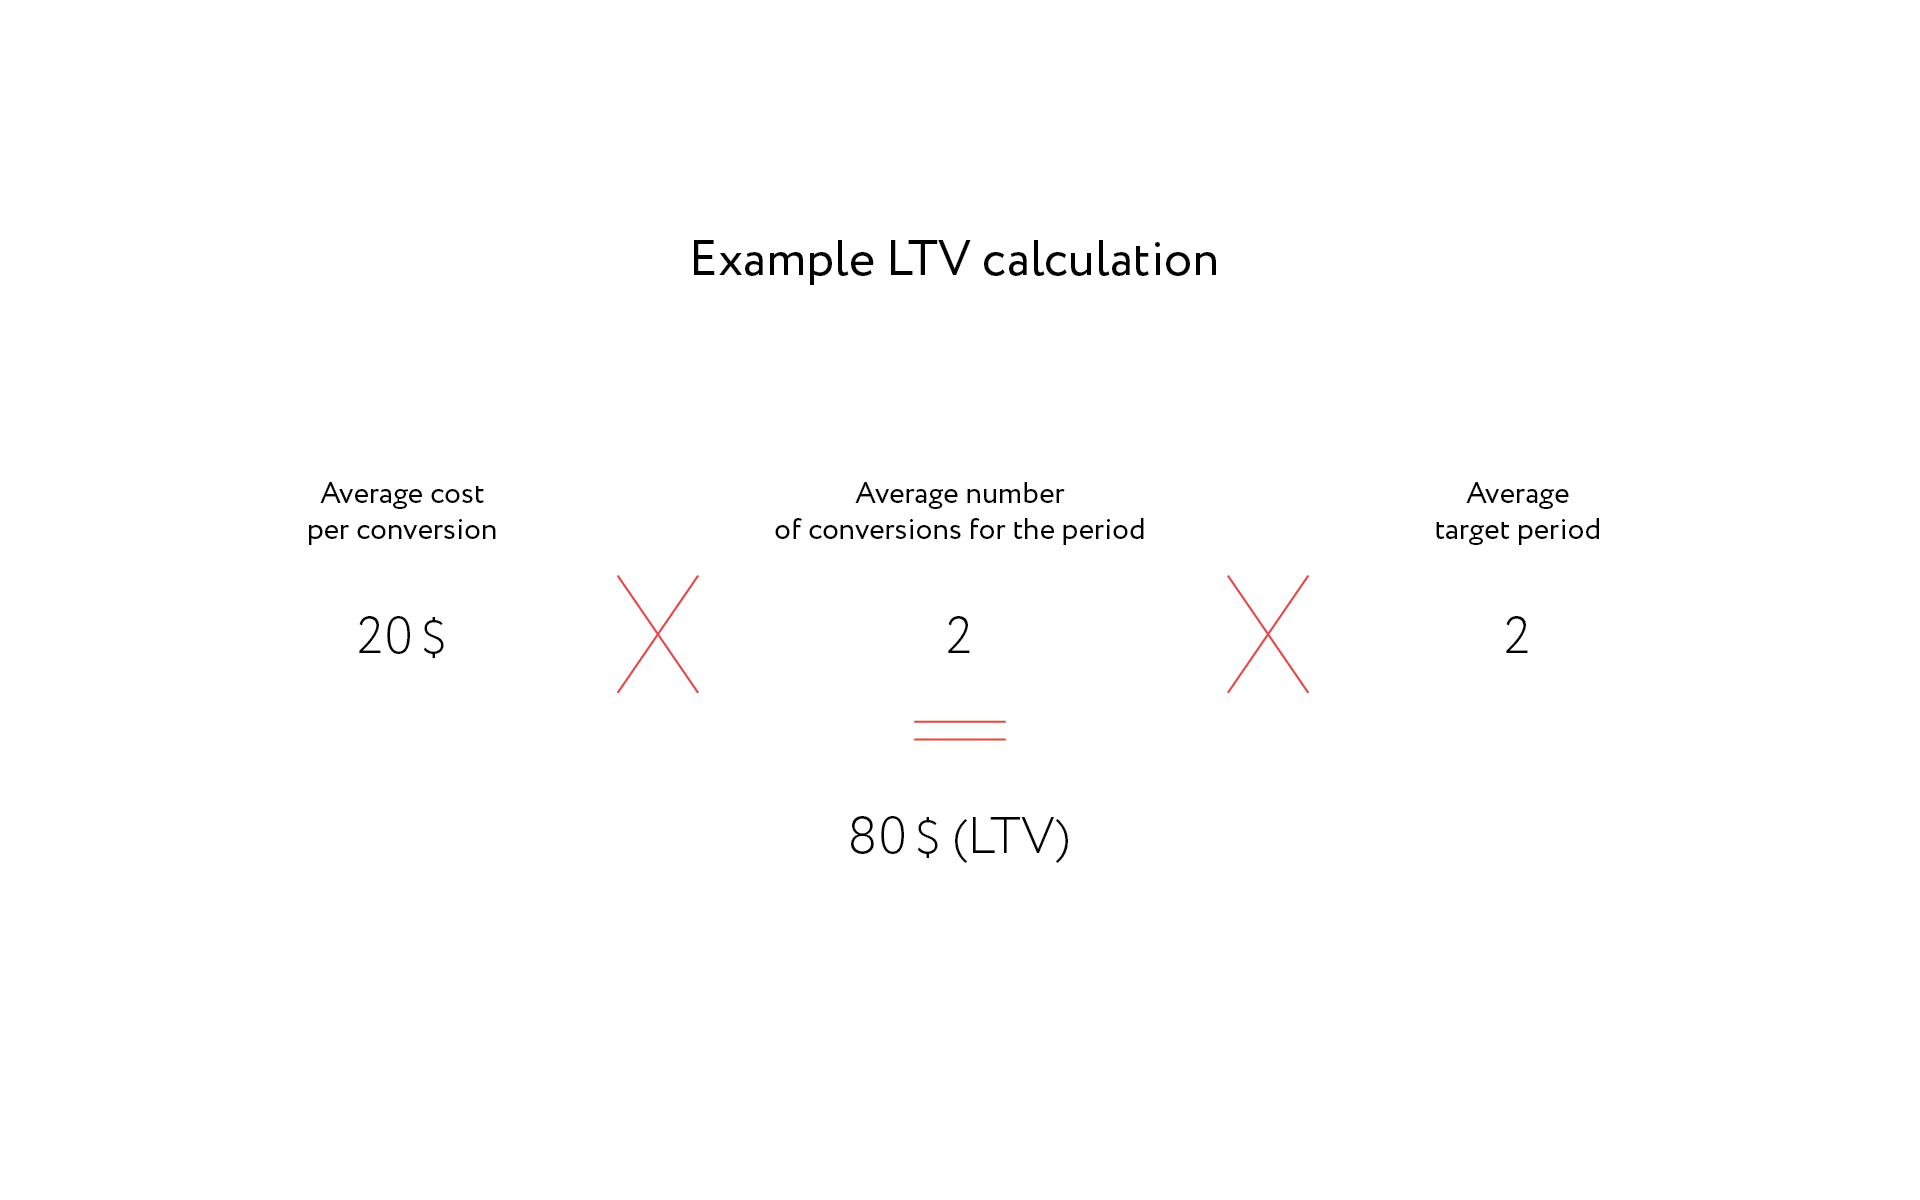
Lifetime Value (LTV)
Customer Lifetime Value is a metric that shows the total revenue amount from a user for as long as they've been a user of an app. This metric allows you to understand how much value you can get from one average product user overall time. The value is usually understood as a profit or income.
To calculate LTV, you need to know:
- how often users take targeted actions;
- what is the monetary value of the targeted action;
- during what period do users take targeted actions.
The average value is calculated, so both regular customers and those who left right away are included. It’s important for LTV to be greater than CPA. If a business spends more money to attract a customer than it gets from them, it is operating at a loss.
Return on Investment (ROI)
The return on investment ratio for marketing in general or a particular advertising campaign.
The formula is simple: (revenue from investment - cost of investment) / (cost of investment) x 100%.
The key indicators of financial metrics are: Gross — revenue for a given period; Paying Share — the ratio of the number of customers that buy paid versions to the total number of unique users. Transactions by User (TBU) is the number of payments per user. It is calculated by dividing the total number of payments for a specified period by the number of payers.
How to calculate the profit
There are two formulas that will help you to estimate the financial indicators: the ARPU and the ARPPU.
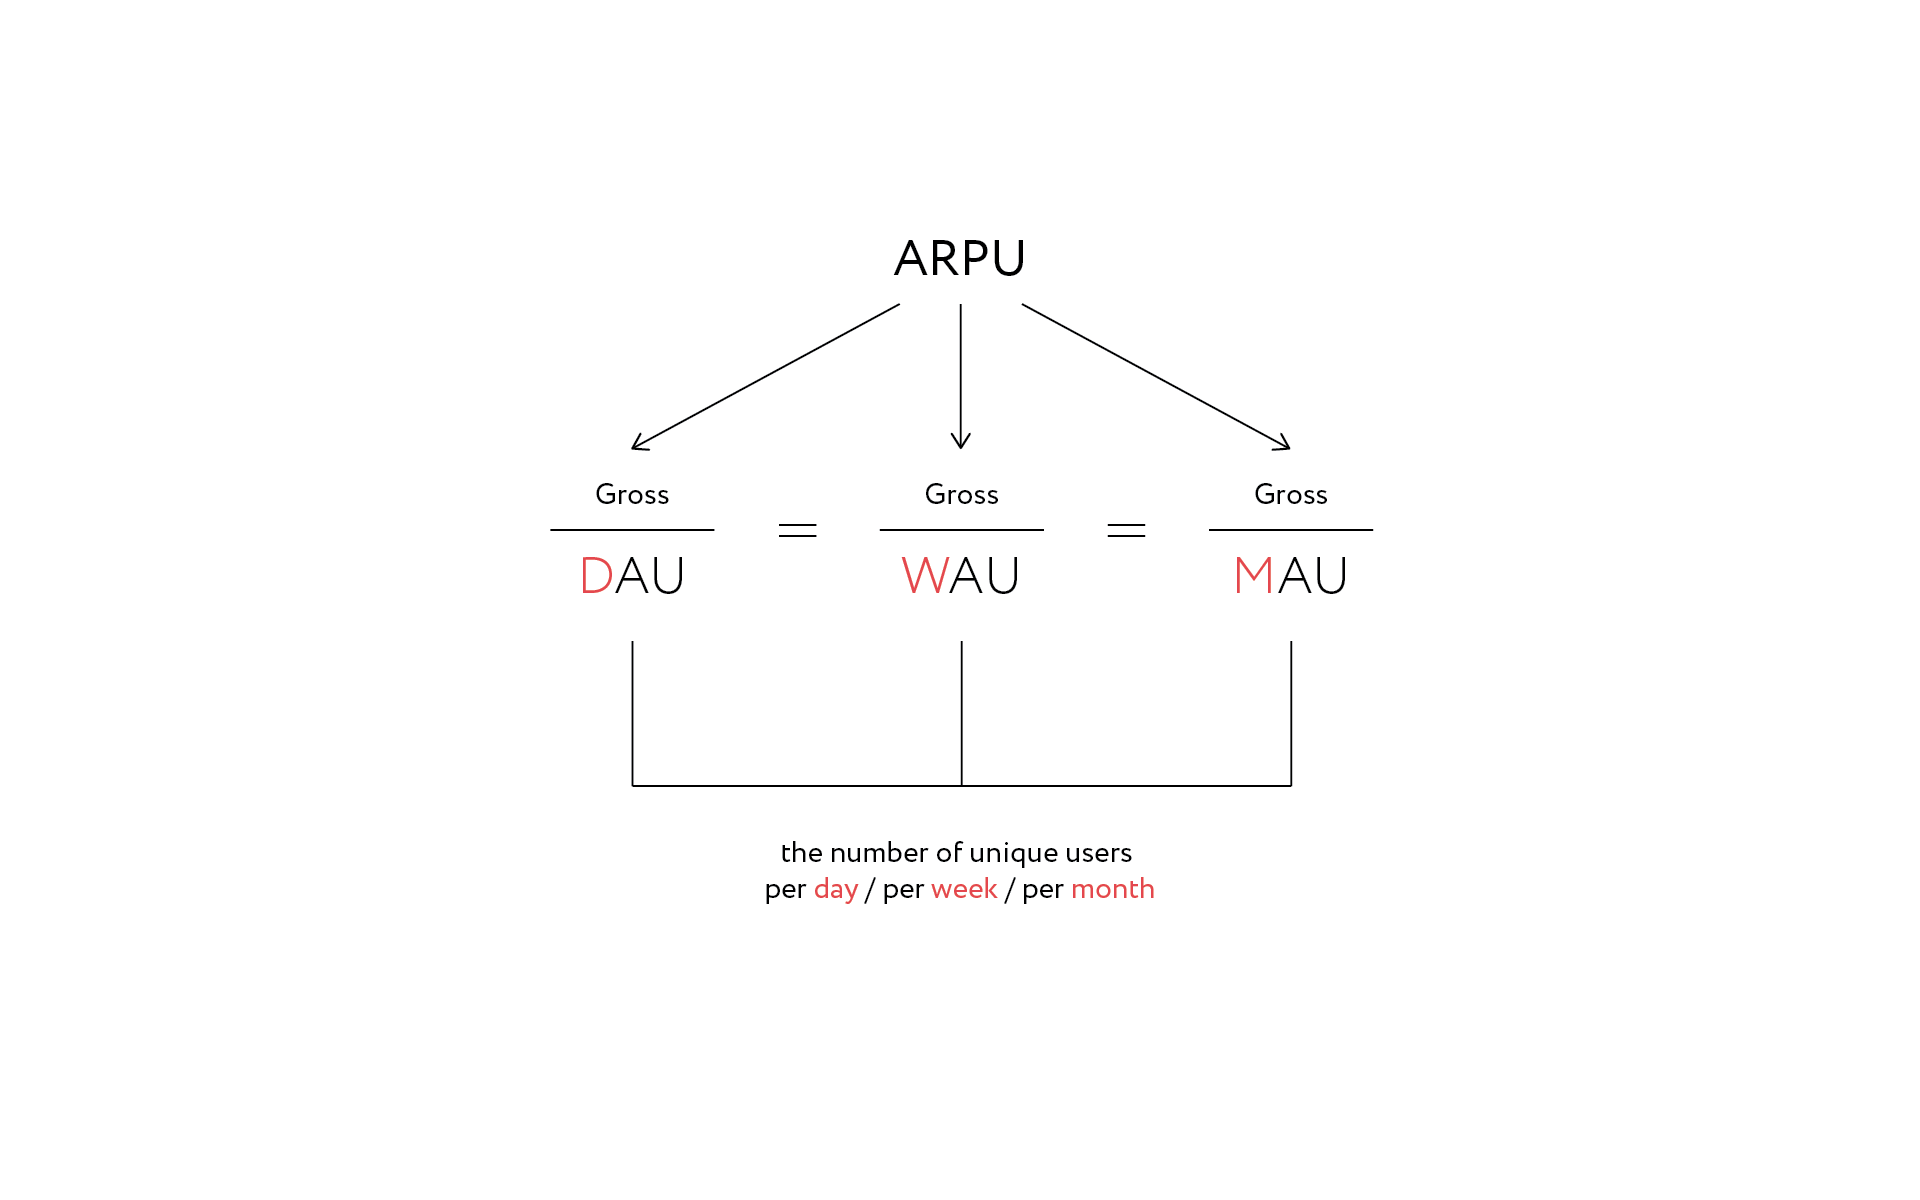
ARPU (Average Revenue Per User) calculates the average profit per customer for a specific period. The metric is determined by the ratio of gross to average attendance per day/week/month. The ARPU index gives you an indication of how effective your project is overall. The index depends, among other things, on your pricing policy.
ARPPU (Average Revenue Per Paying User) is the average profit indicator per user for a specific period. But we are only talking about paying clients who purchase additional content or services from you.
To determine ARPPU, you need to correlate gross with the number of paying users (PU). The ARPPU indicator makes it easy to determine the profitability of paid content/options. You can also note the reaction of users to an app update, an offer of new services or a price increase.
What is the difference between ARPU and ARPPU? These metrics are often confused. Ultimately, ARPU shows the net profit from any user over a period of time, such as a day. Whereas ARPPU only takes into account the profit you've received from paying customers. If no customers bought additional content on any given day, then ARPPU for that day will be zero.
ARPU = Revenue / Users (net revenue / the number of all users)
ARPPU = Revenue / Paying Users (net revenue "divided" by the number of paying users)

ARPPU > APRU As the number of paying users is much lower than the total number of users, ARPPU will always be higher than APRU.
ARPU = ARPPU × Paying Share
If you raise the prices, you might see a decrease in the number of paying users. Paying Share is the share of paying customers. In this case, the profit figure from all customers will increase because the number of paying customers will decrease after you raise prices for additional content/options. To attract more paying customers, you need to build a flexible and "responsive" pricing strategy. And tracking metrics will help you do that. Test hypotheses and don't forget to digitize them. Analytics is the foundation of a solid strategy for developing your app.